


High School Math Statistics & Probability - Common Core curriculum builder and lesson designer for teachers and parents
The only High School Math app on Statistics & Probability designed for students, parents, and teachers! Now with common core curriculum builder and a powerful lesson designer.
Features & Benefits:
• 4 domains, 9 clusters, and 31 standards from Common Core State Standards
• 31 specially crafted sample lessons covering all standards, a quick overview
• More expert created lessons will be available soon, FREE via cloud download!
• Lesson Designer: Create unlimited lessons
• Curriculum Builder: Customize your lesson plans
• Community Support: A global community of teachers and parents
• Teacher & Parental Guidance
• Classroom and Home Settings
• Advanced Bloom’s Taxonomy
• No advertisements, No in-app purchases, No hidden cost
• NEW: Whiteboard Animation included
• NEW: Speed Draw feature included
• NEW: 3 new advanced lesson creation tools included
• NEW: Built-in Text-To-Speech Voice that reads your lesson out loud
• NEW: Create HD Videos in Real-Time
• NEW: Print Postcard or 4x6 Index Card with a tap
• NEW: Support videos inside your lessons
• NEW: Support quizzes with images and videos
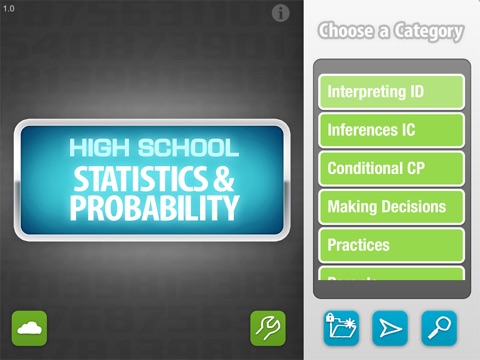
Key Contents:
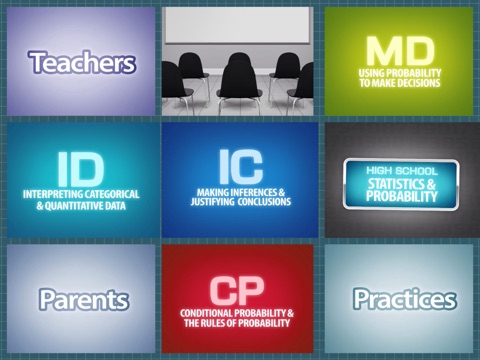
Interpreting Categorical and Quantitative Data (ID)
• Summarize, represent, and interpret data on a single count or measurement variable
• Summarize, represent, and interpret data on two categorical and quantitative variables
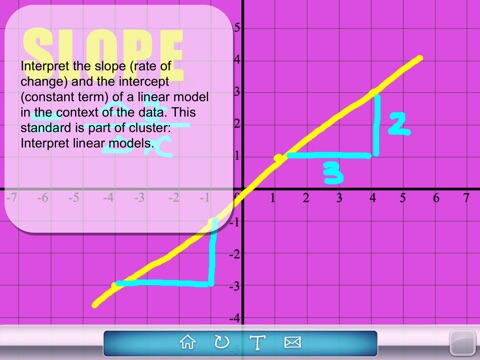
• Interpret linear models
Making Inferences and Justifying Conclusions (IC)
• Understand and evaluate random processes underlying statistical experiments
• Make inferences and justify conclusions from sample surveys, experiments and observational studies
Conditional Probability and the Rules of Probability (CP)
• Understand independence and conditional probability and use them to interpret data
• Use the rules of probability to compute probabilities of compound events in a uniform probability model
Using Probability to Make Decisions (MD)
• Calculate expected values and use them to solve problems
• Use probability to evaluate outcomes of decisions
The high school standards are listed in conceptual categories. Statistics & Probability is one of the 5 conceptual categories. Decisions or predictions are often based on data—numbers in context. These decisions or predictions would be easy if the data always sent a clear message, but the message is often obscured by variability. Statistics provides tools for describing variability in data and for making informed decisions that take it into account. Data are gathered, displayed, summarized, examined, and interpreted to discover patterns and deviations from patterns. Quantitative data can be described in terms of key characteristics: measures of shape, center, and spread. The shape of a data distribution might be described as symmetric, skewed, flat, or bell shaped, and it might be summarized by a statistic measuring center (such as mean or median) and a statistic measuring spread (such as standard deviation or interquartile range). Different distributions can be compared numerically using these statistics or compared visually using plots. Knowledge of center and spread are not enough to describe a distribution. Which statistics to compare, which plots to use, and what the results of a comparison might mean, depend on the question to be investigated and the real-life actions to be taken.
Visit www.engendereducation.com for more information. Or email [email protected] for questions and suggestions. Guarantee response time within 24 hours.
NOTE: To use the Curriculum Builder and Lesson Designer, please download the User’s Guide from our website www.engendereducation.com, or a shortcut at http://bit.ly/15noAfj. We will produce a series of videos showing you how to create advanced lessons that meet every level of the Bloom’s taxonomy. Thank you for your patience.